4/14/2026
Tile Visualisation ROI: The Numbers Every Retailer Should Know

Stop Choosing Tools Based on Features — Choose Based on Profit
When bathroom showroom owners and tile retailers evaluate visualisation software, the conversation usually starts in the wrong place.
“Does it render in 4K?” “How many materials does it support?” “Can we import from CAD?”
These are reasonable questions. But they’re not the questions that determine whether a visualisation tool will actually move the needle on your bottom line.
The right question is simpler: What’s the return on my investment?
Whether you’re a single-location showroom or managing 80+ outlets like Stark Deutschland, every euro spent on software should deliver measurable value. The problem is that most retailers have no framework for measuring this impact. They rely on intuition, anecdotes, or vendor claims that feel too good to be true.
This post changes that. We’ve compiled real performance metrics from leading European tile and bathroom retailers to show you exactly what ROI looks like in this industry. You’ll also get a straightforward formula to calculate your own projections.
Metric 1: Conversion Rate Impact — From Browsers to Buyers
The most fundamental metric: How many customers who walk into your showroom actually buy something?
The tile and bathroom industry typically sees conversion rates between 5% and 25%. That means 75–95% of visitors leave without a purchase — even when they walked in genuinely motivated.
Why? Uncertainty. A customer loves the colour of a floor tile on the sample board, but they can’t picture it across their actual bathroom floor. They like the vanity, but they’re unsure how it pairs with their wall tiles. They’d need three follow-up visits to feel confident enough to commit.
This is where visualisation changes the game. When you can show a customer their chosen products rendered in a believable, photorealistic setting — one that looks real enough to create genuine desire to move in — the gap between “maybe” and “absolutely” closes fast. The visual becomes a decision tool, not just a sales aid. If the rendering looks beautiful but not believable, the customer still walks away thinking “yes, but how will this actually look in my home?” The illusion has to hold.
The Data: Retailers using Spark Vision’s Spark Blueprint report conversion rates that leap from a typical 20–25% baseline to at least 80%. To be clear about what that means: if you’re currently converting one in five walk-ins, you could be converting four in five. That’s not an incremental improvement — it’s a fundamental shift in how your showroom performs.
One mid-sized European showroom chain saw conversion rates climb from 18% to 48% within six months, even before fully optimising their sales process around the tool.
For a showroom with 200 visitors per month, the maths is compelling:
Without visualisation: 40 sales (20% of 200)
With visualisation: 160 sales (80% of 200)
Monthly difference: 120 additional sales
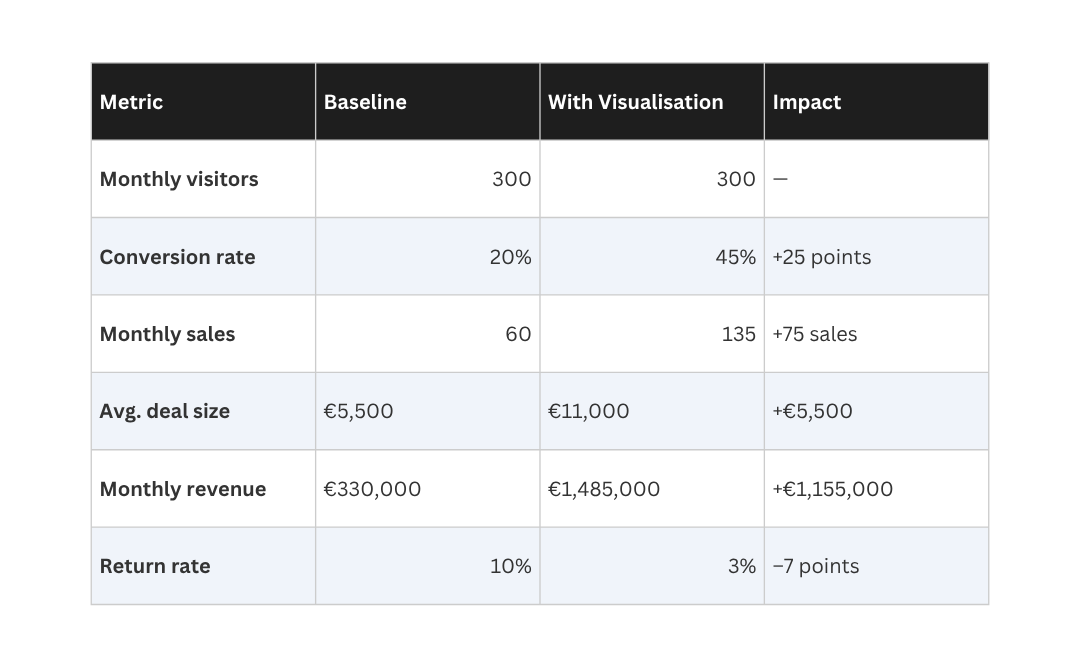
Even using conservative assumptions — say a move from 20% to 45% — you’re looking at 50 additional customers per month choosing to buy.
Metric 2: Average Deal Size — Why Bigger Projects Mean Better Margins
Here’s what happens when customers can actually see the full scope of a project: they buy more.
A customer walks in looking for floor tiles. You sit them down and, within seconds, show them their chosen tile in a complete bathroom setting — with vanity, fixtures, and wall finishes all rendered together. Suddenly they’re not buying floor tiles. They’re buying a bathroom.
Once uncertainty is removed, customers are confident enough to invest in the complete solution rather than piecemeal purchases.
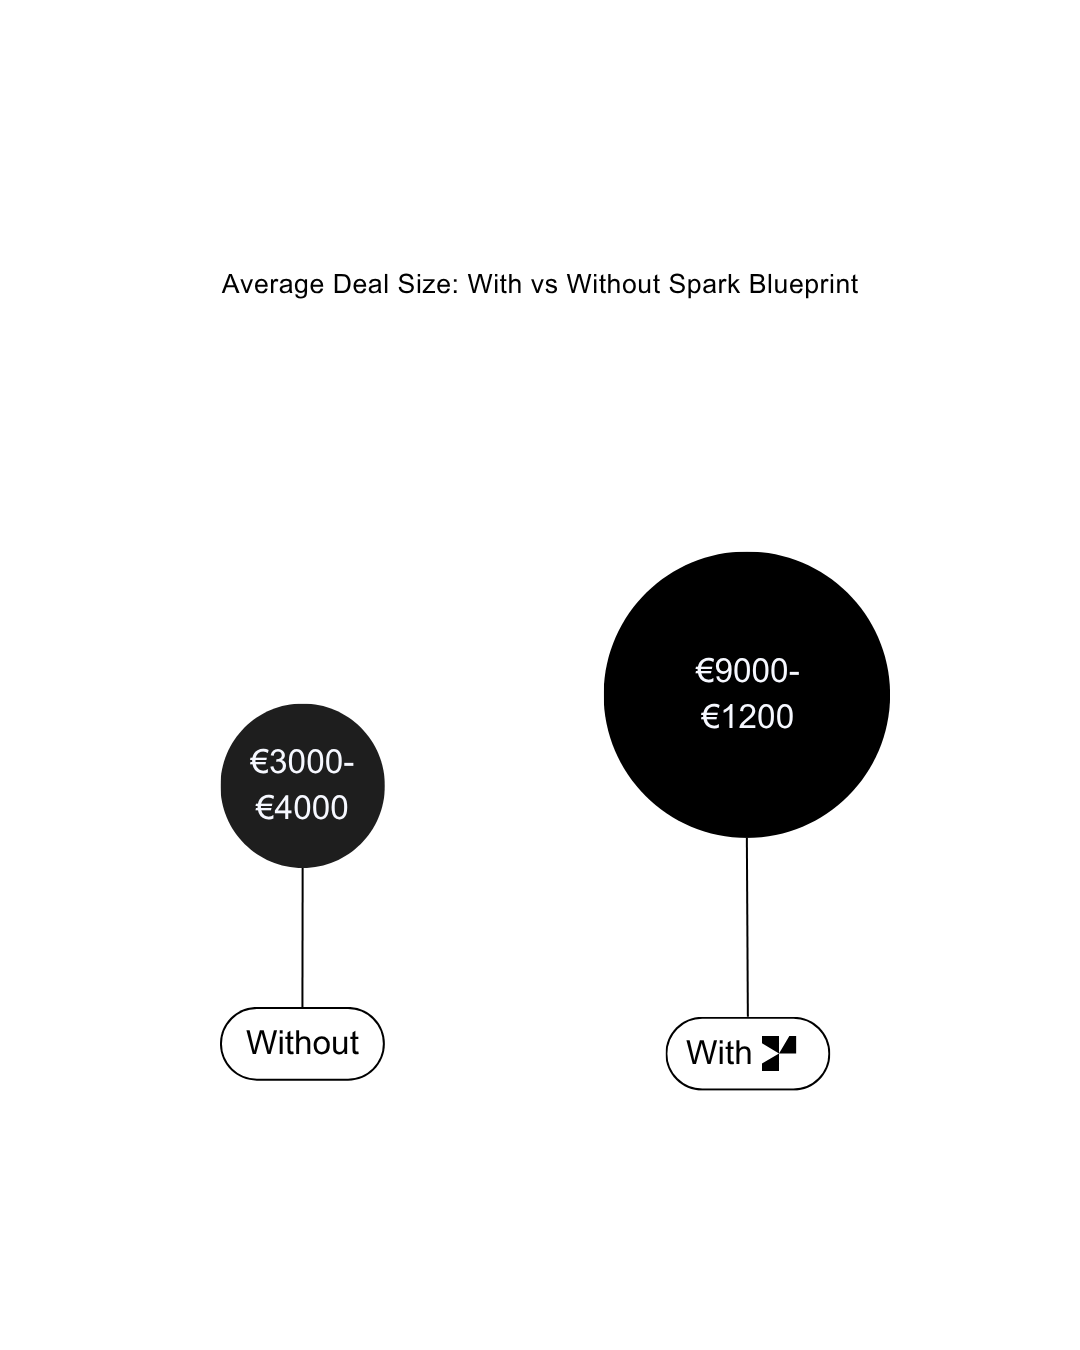
The Data: Retailers using Spark Blueprint report average deal sizes 3x larger than traditional sales processes. A project that might have generated €3,000–€4,000 in revenue now generates €9,000–€12,000.
The arithmetic is clear. If your average sale is currently €5,000 and you sell 40 units monthly (using a 20% conversion baseline with 200 visitors):
Monthly revenue: €200,000
With 3x deal size increase: €600,000
Monthly gain: €400,000
Even assuming a more conservative 2x deal size increase, you’re looking at an additional €200,000 monthly from the same foot traffic.
When a Tile Sale Becomes a Complete Renovation
And then there’s the outlier that reshapes your month. A customer walks in to buy floor tiles — budget: €3,000. Your salesperson shows them a complete bathroom design. They see how new wall tiles, a modern vanity, and coordinated fixtures transform the space. They fall in love with the full picture. That €3,000 floor tile purchase becomes a €30,000+ complete bathroom renovation.
These 10x conversions aren’t the daily norm. But they happen regularly enough — particularly when customers can see a beautiful, believable rendering of the complete solution — that they meaningfully shift your monthly revenue. One or two of these per month can outweigh dozens of standard transactions.
Metric 3: Sales Cycle Reduction — Sub-15-Minute Planning Sessions
Bathroom projects typically involve painful back-and-forth. Customer sees tiles, likes one style, needs to visualise it in their space, goes home to think about it, returns a week later, brings a photo, requests variations.
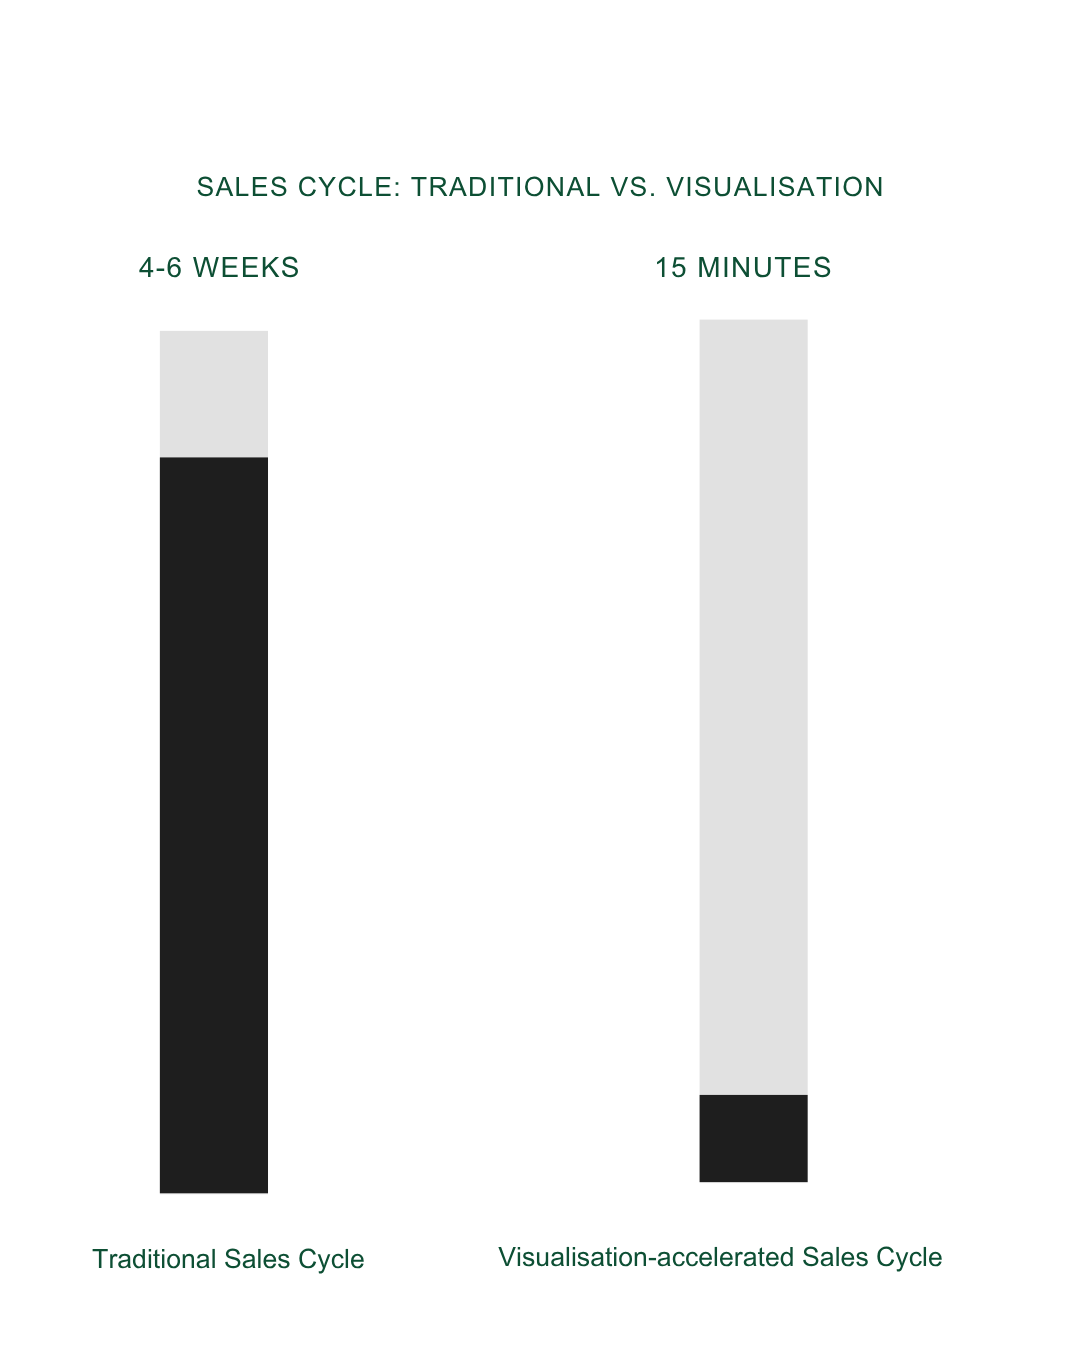
Average sales cycle: 4–6 weeks across multiple visits.
Visualisation tools compress this into a single session.
The Data: Retailers using Spark Blueprint report completing full design consultations in under 15 minutes. Not 15 minutes per follow-up — 15 minutes total from initial consultation to approved design with accurate material quantities.
No additional specification work. No follow-up meetings to confirm details.
Why does this matter for ROI?
Productivity: A salesperson who used to spend 4 weeks across multiple visits on a single customer can now handle that customer plus 15 others in the same timeframe.
Speed: Customers decide faster. When they can see their design rendered beautifully and believably right in front of them, they move forward immediately rather than leaving with a brochure and a promise.
Retention: Customers with a clear visual are far more likely to follow through than customers who are still uncertain. You reduce no-shows and cancellations.
A showroom with 3 full-time salespeople can handle roughly 600 customer interactions monthly. If a quarter of those involve visualisation-assisted sales, and visualisation reduces the cycle from 4 weeks to a single session, you’ve effectively freed up capacity for an additional 150 customers monthly.
Metric 4: Return Rate Reduction — Confident Customers Don’t Return Products
This is the hidden cost nobody talks about: returns.
When customers buy tile, vanities, or fixtures based on imagination alone — without seeing products in a realistic setting — they sometimes get home and realise it doesn’t work. The colour clashes with their lighting. The proportions feel wrong. The style doesn’t integrate with the rest of their bathroom.
They return it. You lose the margin. They complain. Your team spends hours processing the return.
Visualisation solves this because the rendering quality matters. When a customer sees their chosen products in a setting that looks genuinely real — where the difference between glossy and matte finishes is clearly visible, where grout colour choices are obvious, where tile formats show their true proportions — there are no surprises when the products arrive.

The Data: Industry return rates for tile and bathroom products typically run 8–15%. Retailers using visualisation tools report return rates between 2–4%.
[IMAGE: Return rate comparison across showrooms with and without visualisation]
That’s a 50–75% reduction in returns.
The financial impact: if you generate €200,000 monthly in revenue with a 10% return rate, you’re losing €20,000 monthly in returned goods. Reducing that to 3% cuts losses to €6,000 — a monthly saving of €14,000. Over a year: €168,000 in reduced return costs.
Metric 5: Staff Productivity and Upsell Rate Gains
When your sales team has visualisation tools, something shifts. They stop being order-takers and become design consultants.
A customer walks in asking about floor tiles. Your salesperson doesn’t just show them samples — they pull up a complete bathroom setting and, with a single click, swap in the customer’s preferred tile. They show the difference between a large format and a smaller one. They switch between matte and glossy finishes. They try a darker grout to see how it transforms the look. Each change appears instantly — within a fraction of a second — keeping the customer engaged and the momentum building.
The customer leaves with a bigger project and total confidence in their choices.
The Data: Retailers using visualisation tools report 15–25% higher upsell rates. The average customer who came in for one category of product leaves with products from 2–3 categories.
And here’s an operational benefit that’s easy to overlook: the tool is simple enough that temporary staff, weekend extras, and colleagues covering parental leave can use it effectively after minimal training. You’re not dependent on your most experienced salespeople being available. Any team member can deliver a compelling, visual sales experience — which means your conversion rates hold steady even during holidays and staff transitions.
Staff satisfaction increases too. Salespeople find visualisation tools make their job easier and more rewarding. They’re showing solutions, not pushing products. Turnover among sales staff typically decreases, reducing your recruitment and training costs.
How to Calculate Your Own Tile Visualisation ROI
Here’s a framework you can apply to your own showroom immediately. You don’t need perfect data — use your best estimates.
The Basic Formula
Annual ROI = (Revenue Gain + Cost Reductions) – Software Cost
Step 1: Estimate Conversion Rate Impact
Monthly visitors to your showroom: ______
Current conversion rate: ______%
Realistic conversion increase (conservative: 15–25 percentage points): ______%
Additional monthly conversions: ______
Average sale value: €______
Monthly revenue gain from conversions: €______
Step 2: Estimate Deal Size Impact
Average sale value today: €______
Conservative deal size increase: 1.5x to 2x
Monthly sales volume: ______
Monthly revenue gain from deal size: €______
Step 3: Estimate Cost Reductions
Return cost savings:
Current monthly revenue: €______
Current return rate: ______%
Realistic return rate reduction (target: 50–70%): €______
Monthly return savings: €______
Sales staff productivity gains:
Cost of adding one salesperson (salary + overhead): €______ annually
Annual staff cost avoidance: €______
The assumptions above use mid-range figures: a 25 percentage-point conversion increase (we see moves to 80% in best cases), a 2x deal size increase (we see 3x with Spark Blueprint), and a 70% return reduction. Your actual results will depend on your current baseline, showroom size, and how effectively you integrate the technology into your sales process.
Not All Visualisation Tools Deliver the Same ROI
Here’s what separates tools that generate real ROI from expensive demos:
The visuals must be beautiful and believable. Beautiful because they need to create desire — a customer should look at the rendering and feel genuine longing to have that bathroom. Believable because if the image doesn’t look truly realistic, the illusion falls apart. The customer still walks away wondering “yes, but how will this really look?” You no longer have a decision tool — you have a pretty picture. Material accuracy is critical here: the difference between glossy and matte tile finishes, the impact of grout colour, the effect of different tile formats — these details must be visually convincing.
Speed must be instant. If it takes 20 minutes to set up a visualisation, it won’t get used during busy showroom hours. In Digital Showroom, every change appears the moment you press — within a fraction of a second. That speed keeps customers engaged and keeps your salesperson in control of the conversation.
It must be simple enough for any team member. Not just your senior salespeople. The weekend temp. The colleague covering parental leave. The new hire on day three. If your tool requires days of advanced training to master, adoption will stall.
Spark Vision has spent 20+ years understanding what European tile and bathroom retailers actually need. Spark Blueprint turns customer excitement into a complete, photorealistic design with accurate quantities and installer-ready construction drawings — all in under 15 minutes.
Our customers — including Stark (80+ locations), Dansani, and Fliesekompaniet — have documented their ROI in measurable terms. The data in this post comes from real showrooms, not marketing estimates.
The ROI Conversation Starts Here
The biggest barrier to adopting visualisation tools isn’t the cost. It’s the inability to quantify the benefit before you invest.
If the calculation framework in this post shows a clear positive ROI for your showroom — and it likely will — the next step is validating those assumptions with real data from your specific operation.
We offer custom ROI projections based on your current sales metrics, showroom traffic, and product mix. This isn’t generic benchmarking — it’s a concrete financial analysis of what visualisation could mean for your business.
Whether you’re managing a single showroom or a chain of 80+, the numbers suggest it’s not whether visualisation improves your bottom line, but by how much.
Request your own ROI projection
We’ll analyse your current showroom metrics and provide a tailored financial projection. No obligation — just the numbers.
Related Posts
All posts
3 / 25 / 2026
Blog
The Bathroom Retailer’s Guide to Visualisation Software
Every bathroom retailer knows the problem. A customer walks in on a Saturday afternoon ready to renovate their bathroom. They’re genuinely interested — they’ve been scrolling inspiration on Pinterest, they’ve set a budget, they’re motivated.
Read more